Hoang Minh Tue (ESSA Unimelb)
The recent strikes on Qatar’s energy infrastructure were concentrated around the Ras Laffan Industrial City, the world’s largest Liquified Natural Gas (LNG) export hub located on Qatar’s northeastern coast. In essence, reports indicate that the attacks involved a combination of precision missiles and drone strikes targeting critical components of the LNG value chain, particularly liquefaction trains and export terminals. Rather than indiscriminate damage, the strikes appear to have been highly selective thus aimed at disabling throughput capacity rather than destroying the entire complex. In addition, the timing was also strategically significant as the attacks occurred during peak export cycles – when LNG cargoes were scheduled for shipment to Asia and Europe.
The damage added on to global gas supply disruption with consequences likely to persist for years. Qatar – via QatarEnergy, accounts for roughly 20% of global LNG exports, making it one of the central balancing forces in international gas trade. The recent strikes on the Ras Laffan Industrial City have knocked out approximately 17% of the country’s export capacity which is equivalent to around 12-13 million tonnes per annum. (ES Bloomberg, 2025; CNA, 2025) What amplifies the shock is the fundamental rigidity of the LNG markets. Unlike oil which could be rerouted relatively easily, LNG relies on highly specialized liquefaction trains, shipping fleets and regasification terminals, all of which are capital-intensive and slow to scale.
Moreover, the majority of Qatari LNG is locked into long-term contracts with key importers in Asia and Europe thus there is limited flexibility to reallocate cargoes and meet demand elsewhere. Following the loss of Russian pipeline gas, Europe was forced to compete with Asian buyers in marginal LNG bidding—which drove prices up sharply. On top of the gas crisis, the damage has also disrupted associated outputs such as condensates and helium, effectively creating spillover effects into industries ranging from petrochemicals to semiconductors.
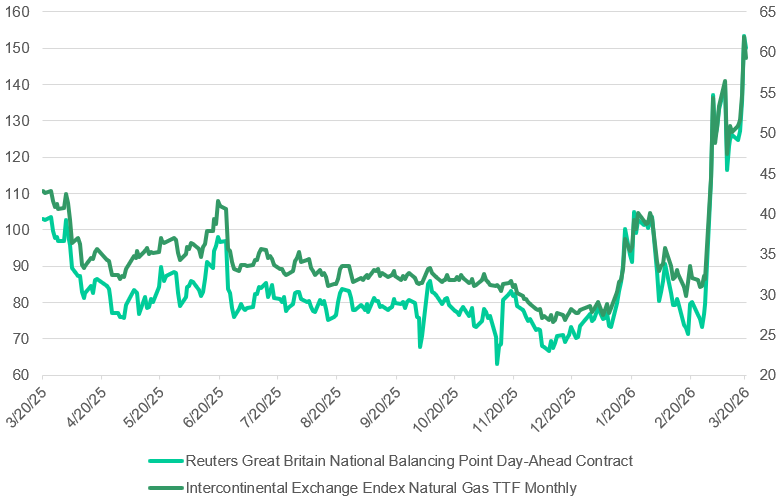
Chart 1: European Gas Prices. Source: LSEG Workspace, 22/03/2026
Looking at Chart 1, we can see once again the 2-round inflation problem embedded in Europe’s post-2022 energy transition. Ever since the pivot of LNG imports from Russia to the US and Qatar, Europe has fundamentally replaced a stable, land-based pipeline system with a seaborne, logistics-dependent network.
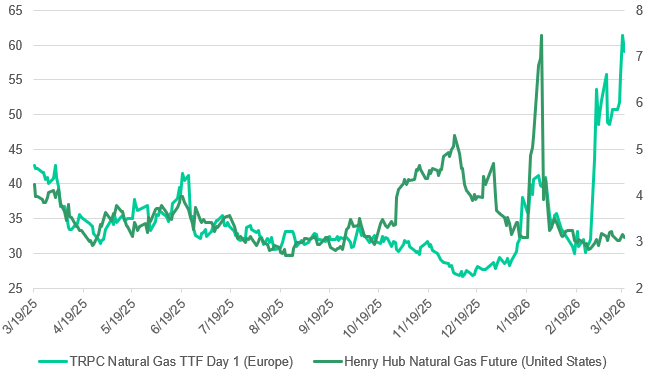
Chart 2: TTF-Henry Hub Spread: Transatlantic Natural Gas Price Dislocation. Source: LSEG Workspace, 22/03/2026
As seen in Chart 2, the Dutch TTF (Title Transfer Facility) contract (the region’s key pricing reference) has surged by as much as 30–45% in recent weeks, with some estimates suggesting prices could double under prolonged disruption scenarios. (S&P Global, 2026) Unlike the United States where domestic production anchored by the Henry Hub benchmark remains relatively stable at around $3-4/MMBtu, European gas prices are highly sensitive to global shocks, often trading at multiples of US levels. The perhaps most consequential result of this spread is European’s relative industrial competitiveness. Energy-intensive sectors such as chemicals and manufacturing now face persistently higher input costs compared to US counterparts, thus raising the likelihood of deindustrialization or relocation.
The surge in TTF prices is more than a reflection of physical scarcity but also of speculative positioning in derivatives markets. Unlike traditional pipeline contracts, LNG pricing is increasingly mediated through hubs and futures, which introduces volatility via hedging flows and algorithmic trading. This creates a feedback loop where price spikes trigger liquidity stress among utilities and traders, therefore forcing position unwinds that further exacerbate price movements. Empirical evidence for this casual relationship is from the 2022 European gas crisis, where margin requirements on TTF contracts increased more than tenfold, contributing to extreme price swings (IEA, 2023). In this context, the Qatar disruption acts as a financial shock transmitted through leveraged market structures (i.e. market where participants control large economic exposures using relatively small amounts of capital, primarily through derivatives).
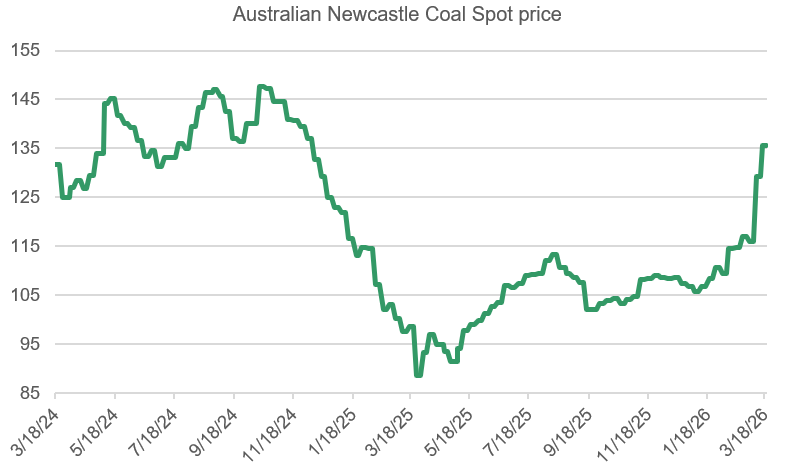
Chart 3: Australia Newcastle Coal Spot Price. Source: LSEG Workspace, 22/03/2026
Looking at Chart 3, Australia, a major coal exporter, is directly benefiting via price increases. As liquefied natural gas (LNG) supplies tighten due to disruptions in key exporters like Qatar and transport chokepoints such as the Strait of Hormuz, parts of Asia—particularly Japan and South Korea, have responded by switching from gas-fired generation to coal (which is currently cheaper and relatively easier to store). At the same time, countries across South and Southeast Asia including Bangladesh, Pakistan, Vietnam, and the Philippines are actively ramping up coal usage to secure electricity supply amid LNG shortages. This resulted in a synchronized increase in coal demand and pushed benchmark prices such as Australia’s Newcastle thermal coal index higher—recently reaching around $129/ton.
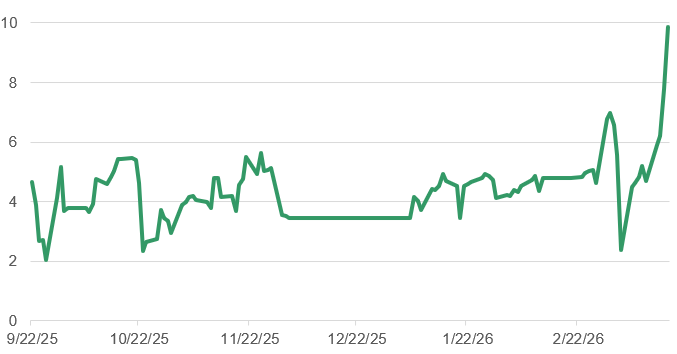
Chart 4: Brent-WTI Month Average Spread Contract. Source: LSEG Workspace, 22/03/2026
Market fragmentation has resulted in uneven crude oil rise. In essence, the widening divergence between Brent crude and West Texas Intermediate (chart 4) has emerged as one of the clearest real-time indicators of structural stress in global energy markets. Brent, which prices seaborne crude flows, has surged significantly due to its direct exposure to disruptions in the Middle East – particularly the effective closure of the Strait of Hormuz. In contrast, WTI remains comparatively insulated due to abundant US shale production and domestic pipeline networks. This divergence has driven the Brent-WTI spread to multi-year highs, reaching as much as $11–$18 per barrel in recent trading.
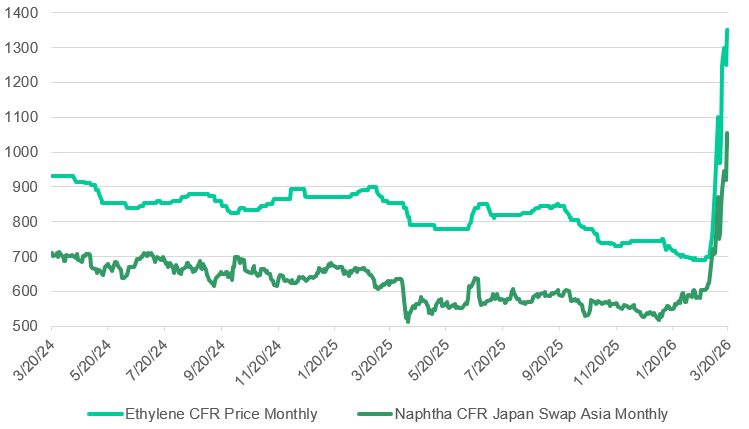
Chart 5: Energy Shock Cascades Through the Petrochemical Chain. Source: LSEG Workspace, 22/03/2026
The petrochemical channel represents one of the less talked about but powerful transmission mechanisms of the current energy shock, extending its impact far beyond fuel markets into the broader economy.
Crude oil prices often directly affect naphtha – the primary feedstock for petrochemical production, which in turn determines the cost of key industrial chemicals such as ethylene. Empirical research shows that naphtha prices move almost one-for-one with crude oil in the long run, while ethylene prices are strongly linked to both oil and naphtha, with correlations often exceeding 0.8 in major markets. This creates a cascading pricing chain in which energy shocks are rapidly transmitted downstream. As feedstock costs rise, petrochemical producers pass these increases through to downstream products, particularly ethylene, which serves as the foundational building block for plastics, packaging, synthetic fibers and a wide range of other consumer and industrial goods.
References
Hoisch, M., & Burgess, J. (2026). INTERVIEW: Elengy sustains European LNG offerings, advances transition aims. S&P Global. https://www.spglobal.com/energy/en/news-research/latest-news/natural-gas/032626-interview-elengy-sustains-european-lng-offerings-advances-transition-aims
Liao, R., & Sherif Tarek. (2026, March 18). World’s Largest LNG Plant Suffers Extensive Damage, Qatar Says. Bloomberg.com; Bloomberg. https://www.bloomberg.com/news/articles/2026-03-18/qatar-reports-extensive-damage-at-site-of-ras-laffan-lng-plant
Murtaugh, D. (2026, March 19). Attacks on Qatar Make LNG’s Worst Nightmare a Reality. Bloomberg.com; Bloomberg. https://www.bloomberg.com/news/newsletters/2026-03-19/attacks-on-qatar-make-lng-s-worst-nightmare-a-reality